Stage 5: Model Adequacy
Objective
Decide whether the fitted model is a credible description of the observed data.
This is the stage that sits between computational trust and business interpretation. A model can pass sampler diagnostics and still fail here.
The key question
If I simulate from the fitted model, does it reproduce the important structure of the observed data well enough for decomposition, comparison, and optimisation to be taken seriously?
What to inspect first
1. Fitted-versus-observed behaviour over time
Ask:
- does the model track the broad level and movement of the KPI?
- are there long runs of systematic over- or under-prediction?
- are key seasonal or event patterns still unexplained?
2. Posterior predictive checks
Posterior predictive plots tell you whether the fitted model can generate data that look like what you observed.
In DSAMbayes, this is the right way to think about the ppc.png artifact: not as decoration, but as an adequacy check.
3. Residual behaviour
Residual autocorrelation or visible structure usually means the model has not absorbed an important baseline, timing, or event component.
4. LOO and Pareto-k
Model comparison and calibration-style plots help answer:
- which candidate model predicts better?
- are some observations highly influential?
- is the leave-one-out approximation trustworthy?
These are useful, but they should not override a bad adequacy profile.
What this stage means for decisions
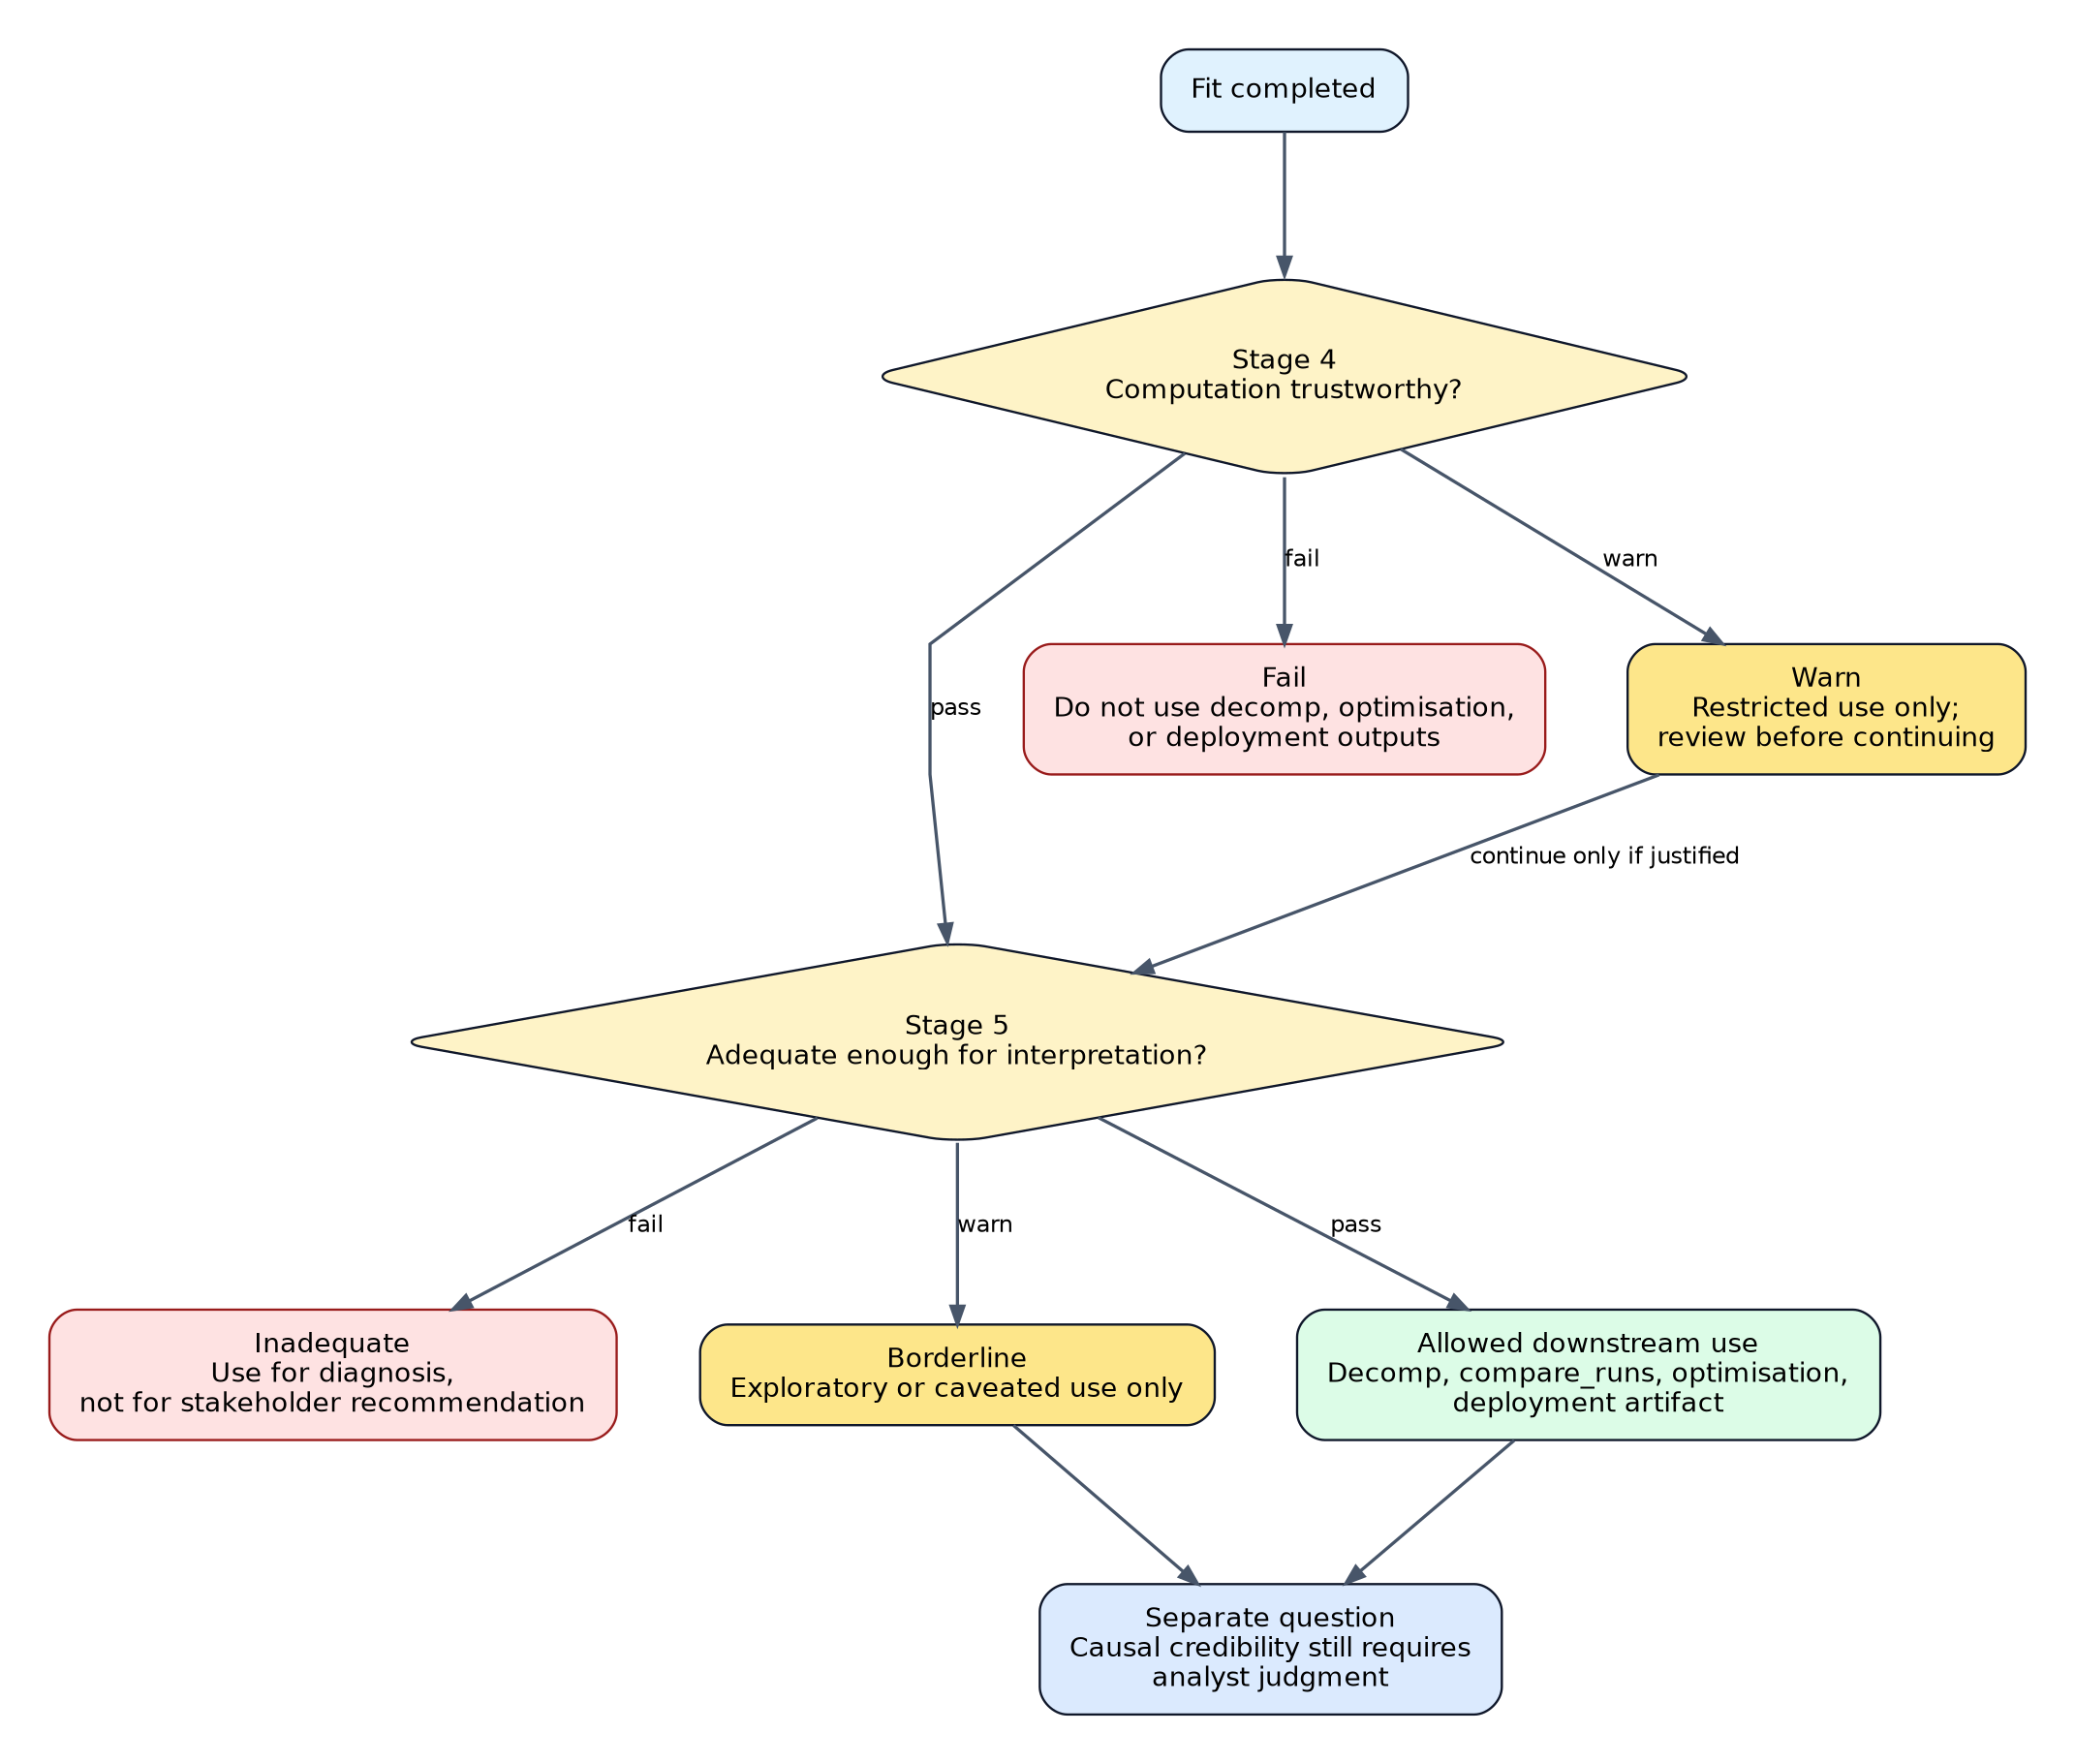
The main practical consequence of Stage 5 is that predictive ranking and downstream business outputs are conditional on adequacy. Passing computation checks is not enough if the fitted model still behaves poorly against the data.
If adequacy is poor
Do not interpret decomposition shares as if they were stable statements about media contribution.
Do not treat optimisation outputs as reliable budget guidance.
Use the run to diagnose misspecification, then revise the model.
If adequacy is acceptable but not clean
A warning-level result may still be useful for exploratory work, but the caveat should travel with the output.
Adequacy is not the same as causality
A model can:
- fit well
- calibrate well
- compare well by predictive metrics
and still produce biased media-effect interpretation if confounding or structural misspecification remains.
So Stage 5 is a gate on model adequacy, not proof of causal validity.
Practical DSAMbayes reading order
- Check Stage 4 first: are the draws trustworthy?
- Inspect fit plots and PPC
- Inspect residual diagnostics
- Inspect LOO / Pareto-k and compare candidate runs
- Only then interpret decomposition or decision-layer outputs
Common failure patterns
Pattern 1: good convergence, bad residual structure
Interpretation: the sampler worked, but the baseline or control structure is incomplete.
Pattern 2: good fit plot, unstable influential observations
Interpretation: apparent adequacy may depend too heavily on a small number of points. Treat model comparison and downstream interpretation cautiously.
Pattern 3: good predictive fit, weak causal story
Interpretation: the model may be operationally useful for forecasting or scenario analysis, but not for strong causal claims about media.
Relevant DSAMbayes surfaces
40_diagnostics/diagnostics_report.csv40_diagnostics/ppc.png- residual plots in
40_diagnostics/ 50_model_selection/pareto_k.pngcompare_runs()