Model Selection Plots
Purpose
Model selection plots provide leave-one-out cross-validation (LOO-CV) diagnostics for predictive fit and influence. They help identify observations that destabilise the PSIS approximation. These plots are written to 50_model_selection/ within the run directory.
The runner generates them via write_model_selection_artifacts() in R/run_artifacts_diagnostics.R. LOO-CV is computed using Pareto-smoothed importance sampling (PSIS-LOO) from the loo package, which approximates exact leave-one-out predictive densities from a single MCMC fit. All three plots depend on the pointwise LOO table (loo_pointwise.csv), which contains per-observation ELPD contributions, Pareto-k diagnostics, and influence flags.
PSIS-LOO assumes conditionally exchangeable pointwise observations. For time-ordered MMM model selection, use blocked or leave-future-out CV as the primary evidence. Treat these plots as supplementary fit and influence diagnostics.
Plot catalogue
| Filename | What it shows | Conditions |
|---|---|---|
pareto_k.png |
Pareto-k diagnostic scatter over time | Pointwise LOO table available with pareto_k column |
elpd_influence.png |
Pointwise ELPD contributions over time | Pointwise LOO table available with elpd_loo and pareto_k columns |
Pareto-k diagnostic
Filename: pareto_k.png
What it shows
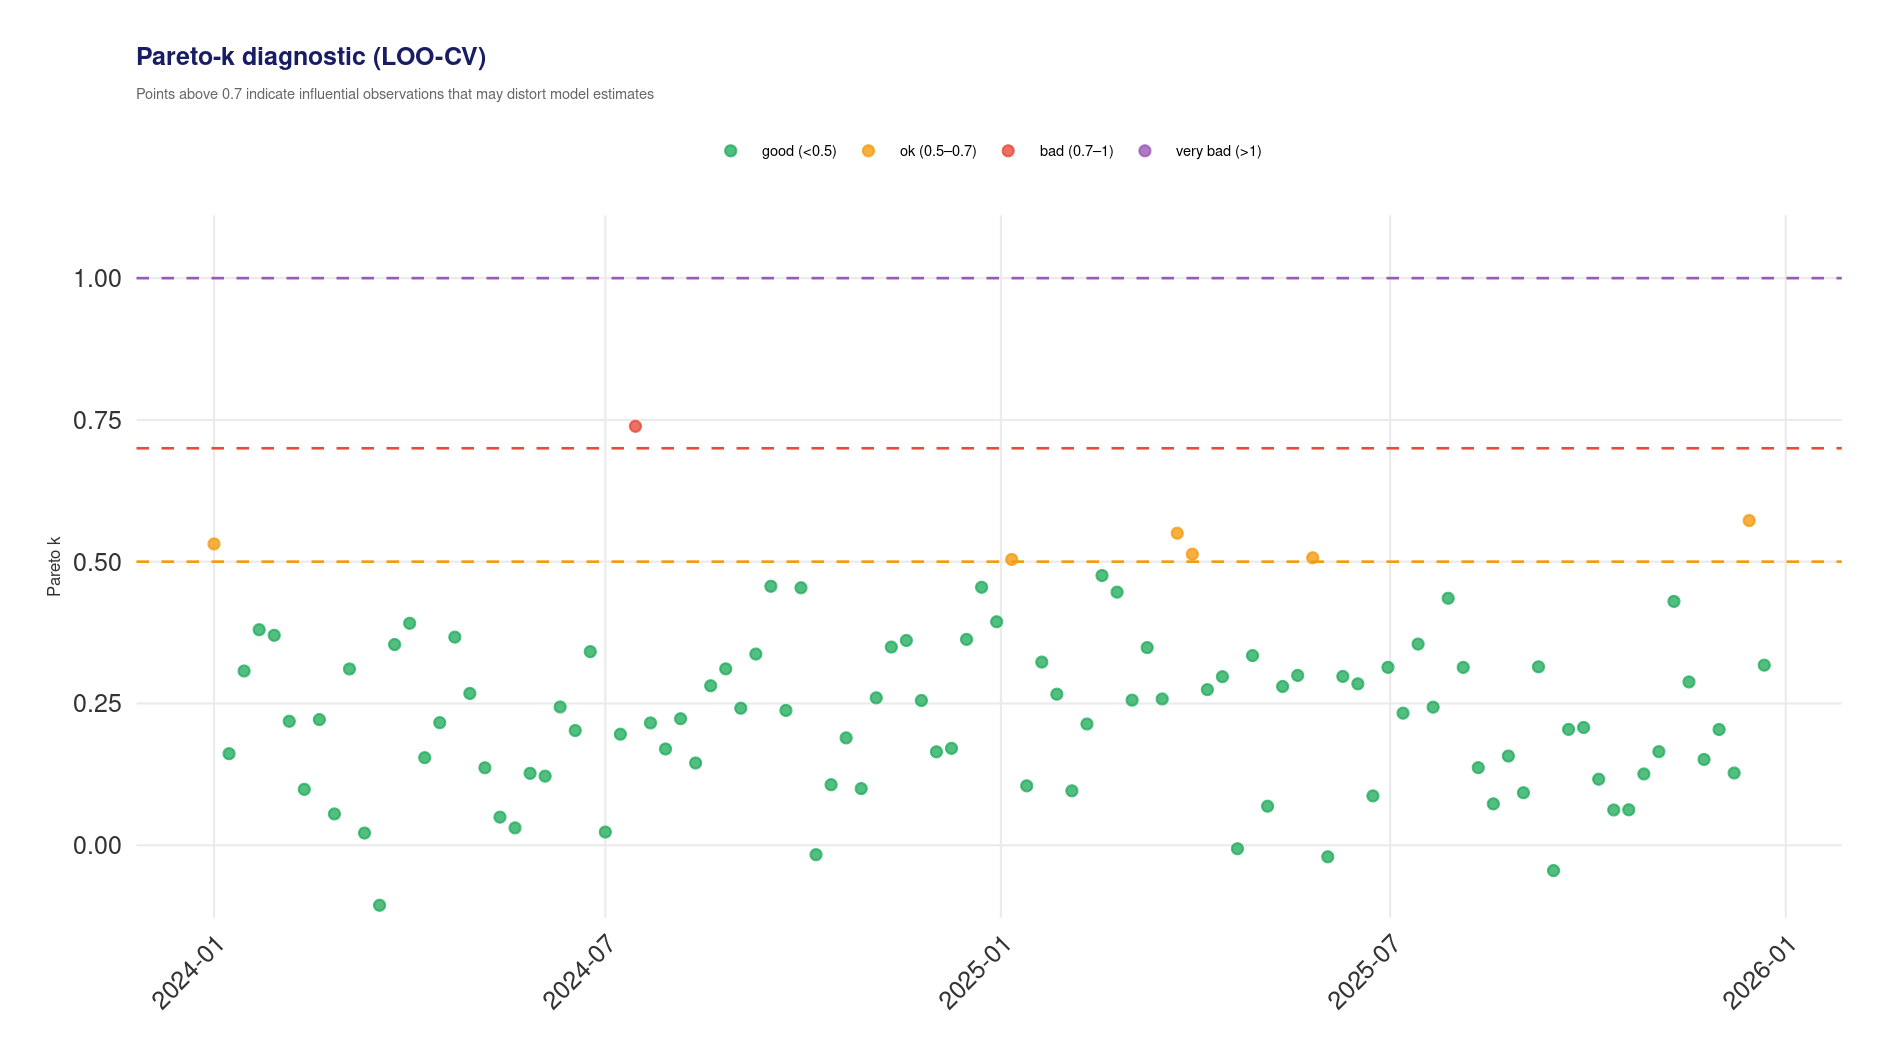
A scatter plot of Pareto-k values over time, one point per observation. Points are colour-coded by severity:
- Green (k < 0.5): PSIS approximation is reliable.
- Amber (0.5 ≤ k < 0.7): Approximation is acceptable but warrants monitoring.
- Red (0.7 ≤ k < 1.0): Approximation is unreliable. The observation is influential.
- Purple (k > 1.0): PSIS fails entirely. The observation dominates the posterior.
Dashed horizontal lines mark the 0.5, 0.7, and 1.0 thresholds. The legend always displays all four severity levels regardless of whether points exist in each category.
When it is generated
The runner generates this plot whenever the pointwise LOO table contains a pareto_k column. This requires a successful PSIS-LOO computation, which in turn requires the fitted model to produce log-likelihood values.
How to interpret it
Most points should be green. A small number of amber points is typical and does not invalidate the LOO estimate. Red and purple points identify observations where the posterior changes substantially when that observation is excluded, these are influential data points.
Influential observations concentrated in a specific time period (e.g. a cluster of red points around a holiday) suggest that the model struggles with those conditions. Isolated influential points may correspond to data anomalies or outliers.
Warning signs
- More than 10% of points above 0.7: The overall PSIS-LOO estimate is unreliable. The
loopackage will issue a warning. Consider moment-matching or exact refitting for affected observations. - Purple points (k > 1): These observations are so influential that removing them would substantially change the posterior. Investigate whether they represent data errors, one-off events, or genuine but rare conditions.
- Influential points at the start or end of the series: Edge effects in adstock transforms can create artificial influence at series boundaries.
Action
For isolated red/purple points, inspect the corresponding dates and data values. If they are data errors, correct the data. If they are genuine but extreme, consider whether the model’s likelihood (Normal) is appropriate, heavy-tailed alternatives (Student-t) are more robust to outliers. If influential points are numerous, the model may be misspecified more broadly: revisit the formula, priors, and functional form.
Related artefacts
loo_pointwise.csvin50_model_selection/contains the per-observation Pareto-k, ELPD, and influence flags.loo_summary.csvin50_model_selection/reports the aggregate ELPD with standard error.
ELPD influence plot
Filename: elpd_influence.png
What it shows
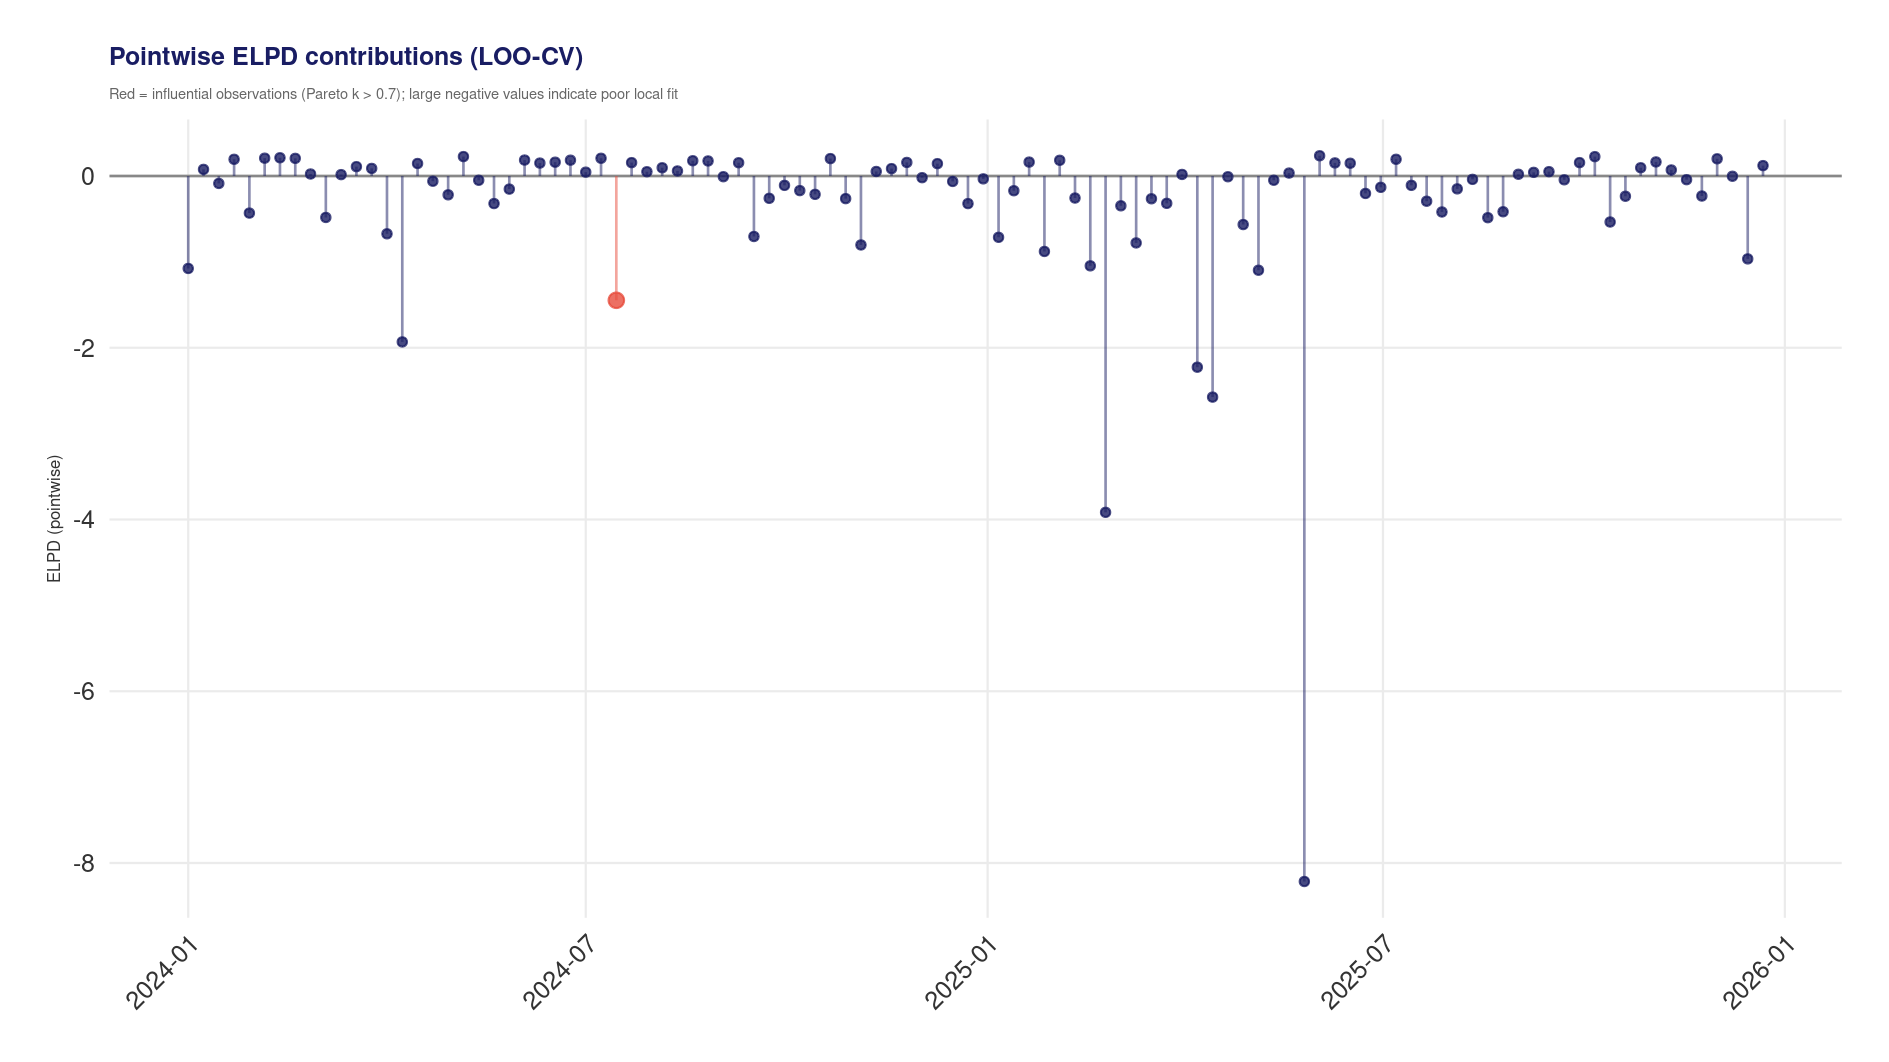
A lollipop chart of pointwise expected log predictive density (ELPD) contributions over time. Each vertical stem connects the observation’s ELPD value to zero; the dot marks the ELPD value. Blue points and stems indicate non-influential observations (Pareto-k ≤ 0.7); red indicates influential ones (Pareto-k > 0.7). Larger red dots draw attention to the problematic observations.
When it is generated
The runner generates this plot whenever the pointwise LOO table contains both elpd_loo and pareto_k columns. It is written by write_model_selection_artifacts() in R/run_artifacts_diagnostics.R, immediately after the Pareto-k scatter.
How to interpret it
ELPD values quantify each observation’s contribution to the model’s out-of-sample predictive performance. Values near zero indicate observations that the model predicts well. Large negative values indicate observations where the model assigns low predictive probability, these are the worst-predicted points.
The combination of ELPD magnitude and Pareto-k severity is informative:
- Large negative ELPD + low k: The model predicts this observation poorly, but the PSIS estimate is reliable. The model genuinely struggles with this data point.
- Large negative ELPD + high k: Both the prediction and the LOO approximation are unreliable. This observation is highly influential and poorly fit, it warrants the closest scrutiny.
- Near-zero ELPD + high k: The observation is influential but well-predicted. It may be a leverage point (extreme in predictor space) that happens to lie on the fitted surface.
Warning signs
- Cluster of large negative values in a specific period: The model systematically fails during that period. Check for missing events, structural breaks, or data quality problems.
- Many red (influential) points with large negative ELPD: The model’s aggregate LOO estimate is unreliable, and the worst-fit observations are also the most influential. This combination makes model comparison results untrustworthy.
- Monotone trend in ELPD values: Suggests time-varying model adequacy, the model may fit the training period well but degrade towards the edges.
Action
Investigate the dates of the worst ELPD observations. If they correspond to known anomalies (data errors, one-off events), consider excluding or down-weighting them. If they correspond to regular conditions that the model should handle, the model needs revision. Use the Pareto-k plot to confirm which observations are both poorly predicted and influential, and prioritise those for investigation.
Related artefacts
loo_pointwise.csvin50_model_selection/contains the full pointwise table with ELPD, Pareto-k, and influence flags.loo_summary.csvin50_model_selection/reports the aggregate ELPD estimate and standard error for model comparison.
Cross-references
- Diagnostics plots, residual-level checks that complement LOO diagnostics
- Model fit plots, posterior summaries and fitted-vs-observed views
- Runner output artefacts, complete artefact inventory
- Plot index